★Viz YOUR World ★Viz YOUR World ★
It’s your turn to tell a data story. Choose a project to get started!
🚧 Under Construction
With more than a dozen built-in customizable templates, the VizIt projects inspire students to create their own
data story posters to share with family and friends.
Each project includes detailed instructions for collecting, organizing, analyzing, and presenting the data.
Teachers evaluate students’ projects with a scoring rubric based on the GAISE II guidelines developed by the
American Statistical Association.
Favorite Songs
Favorite Songs
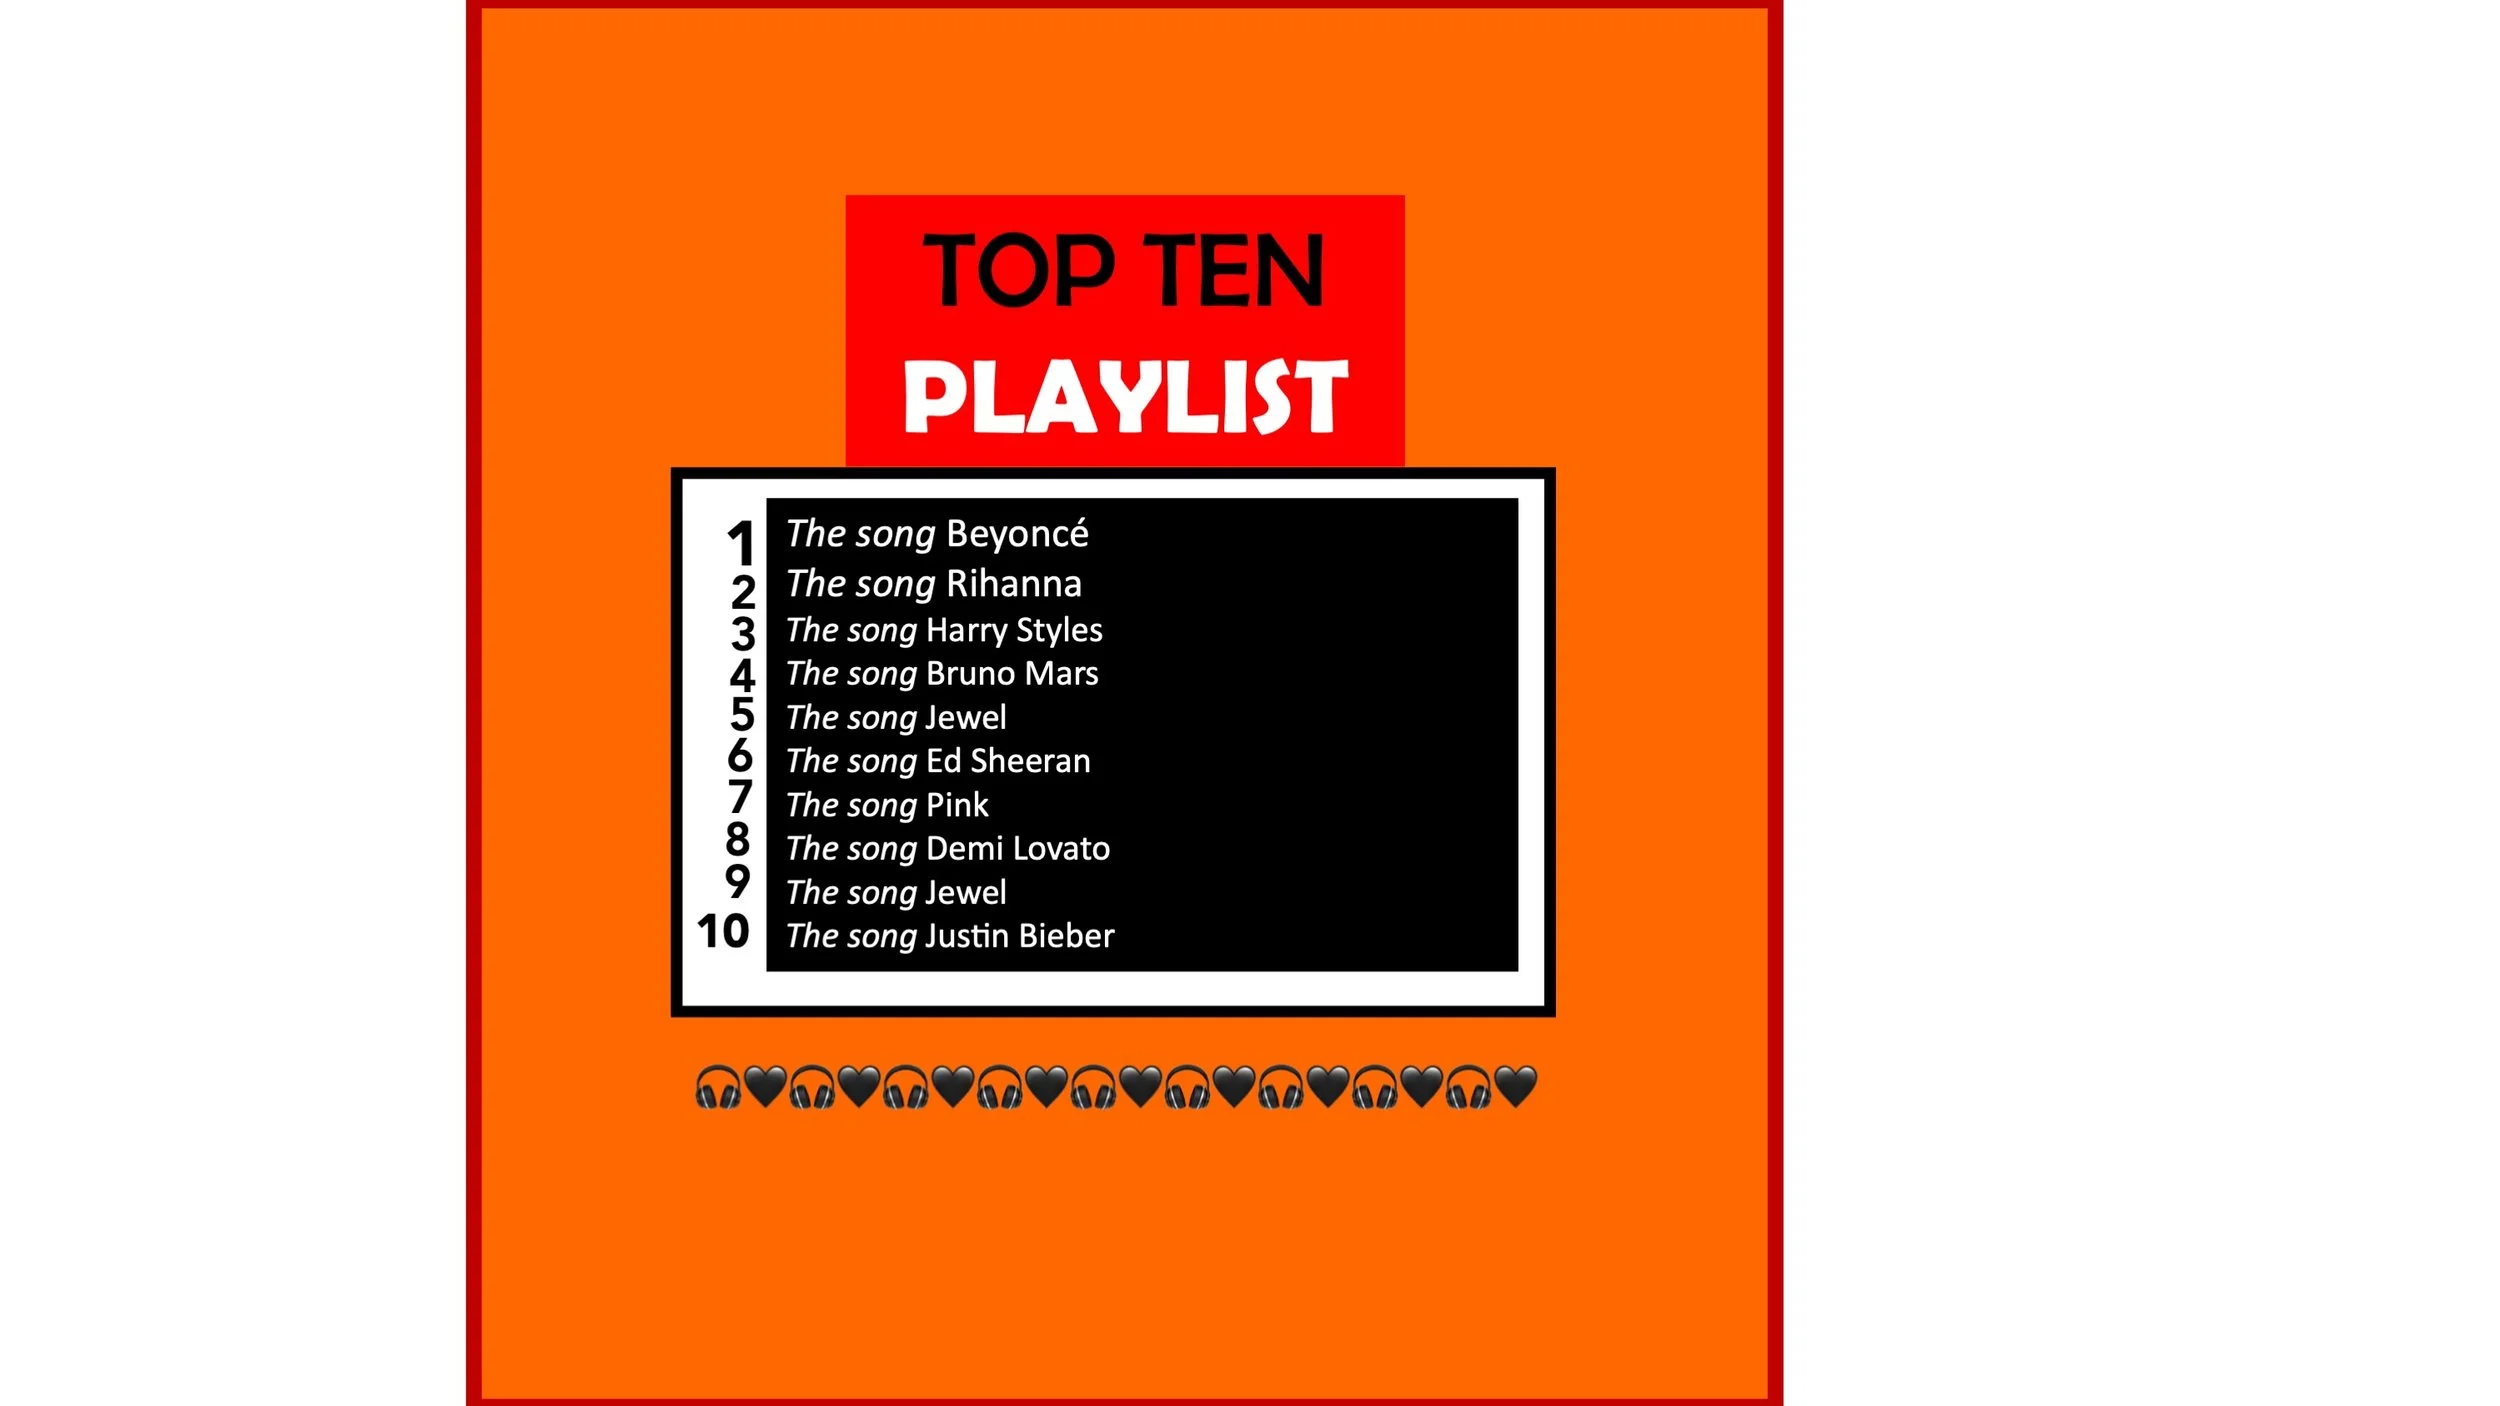
Rank the songs
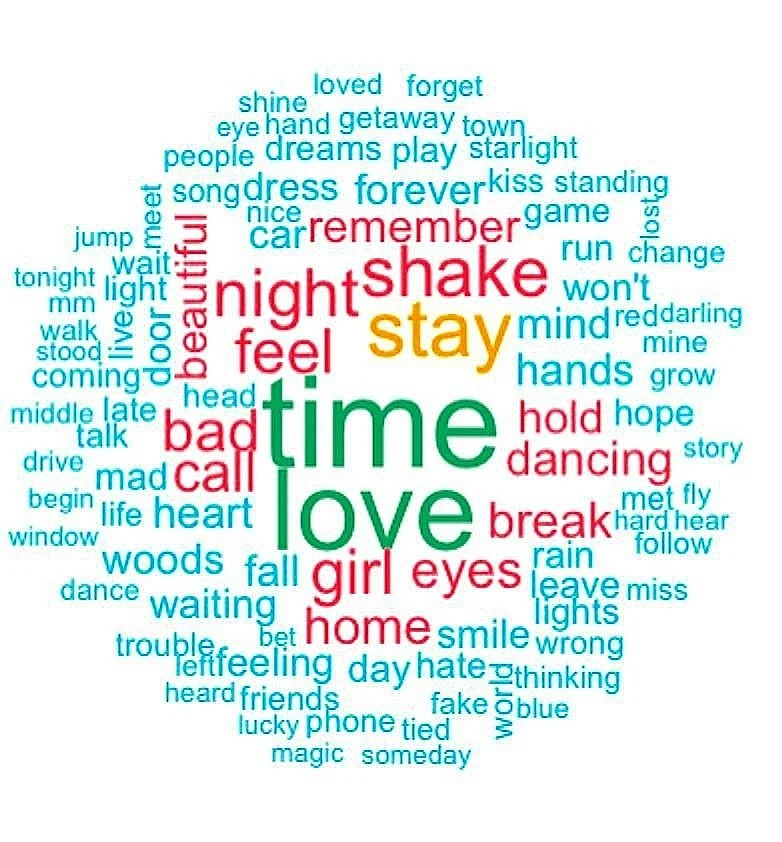
Chart the lyrics
Map artists’ hometowns
All About You
All About You
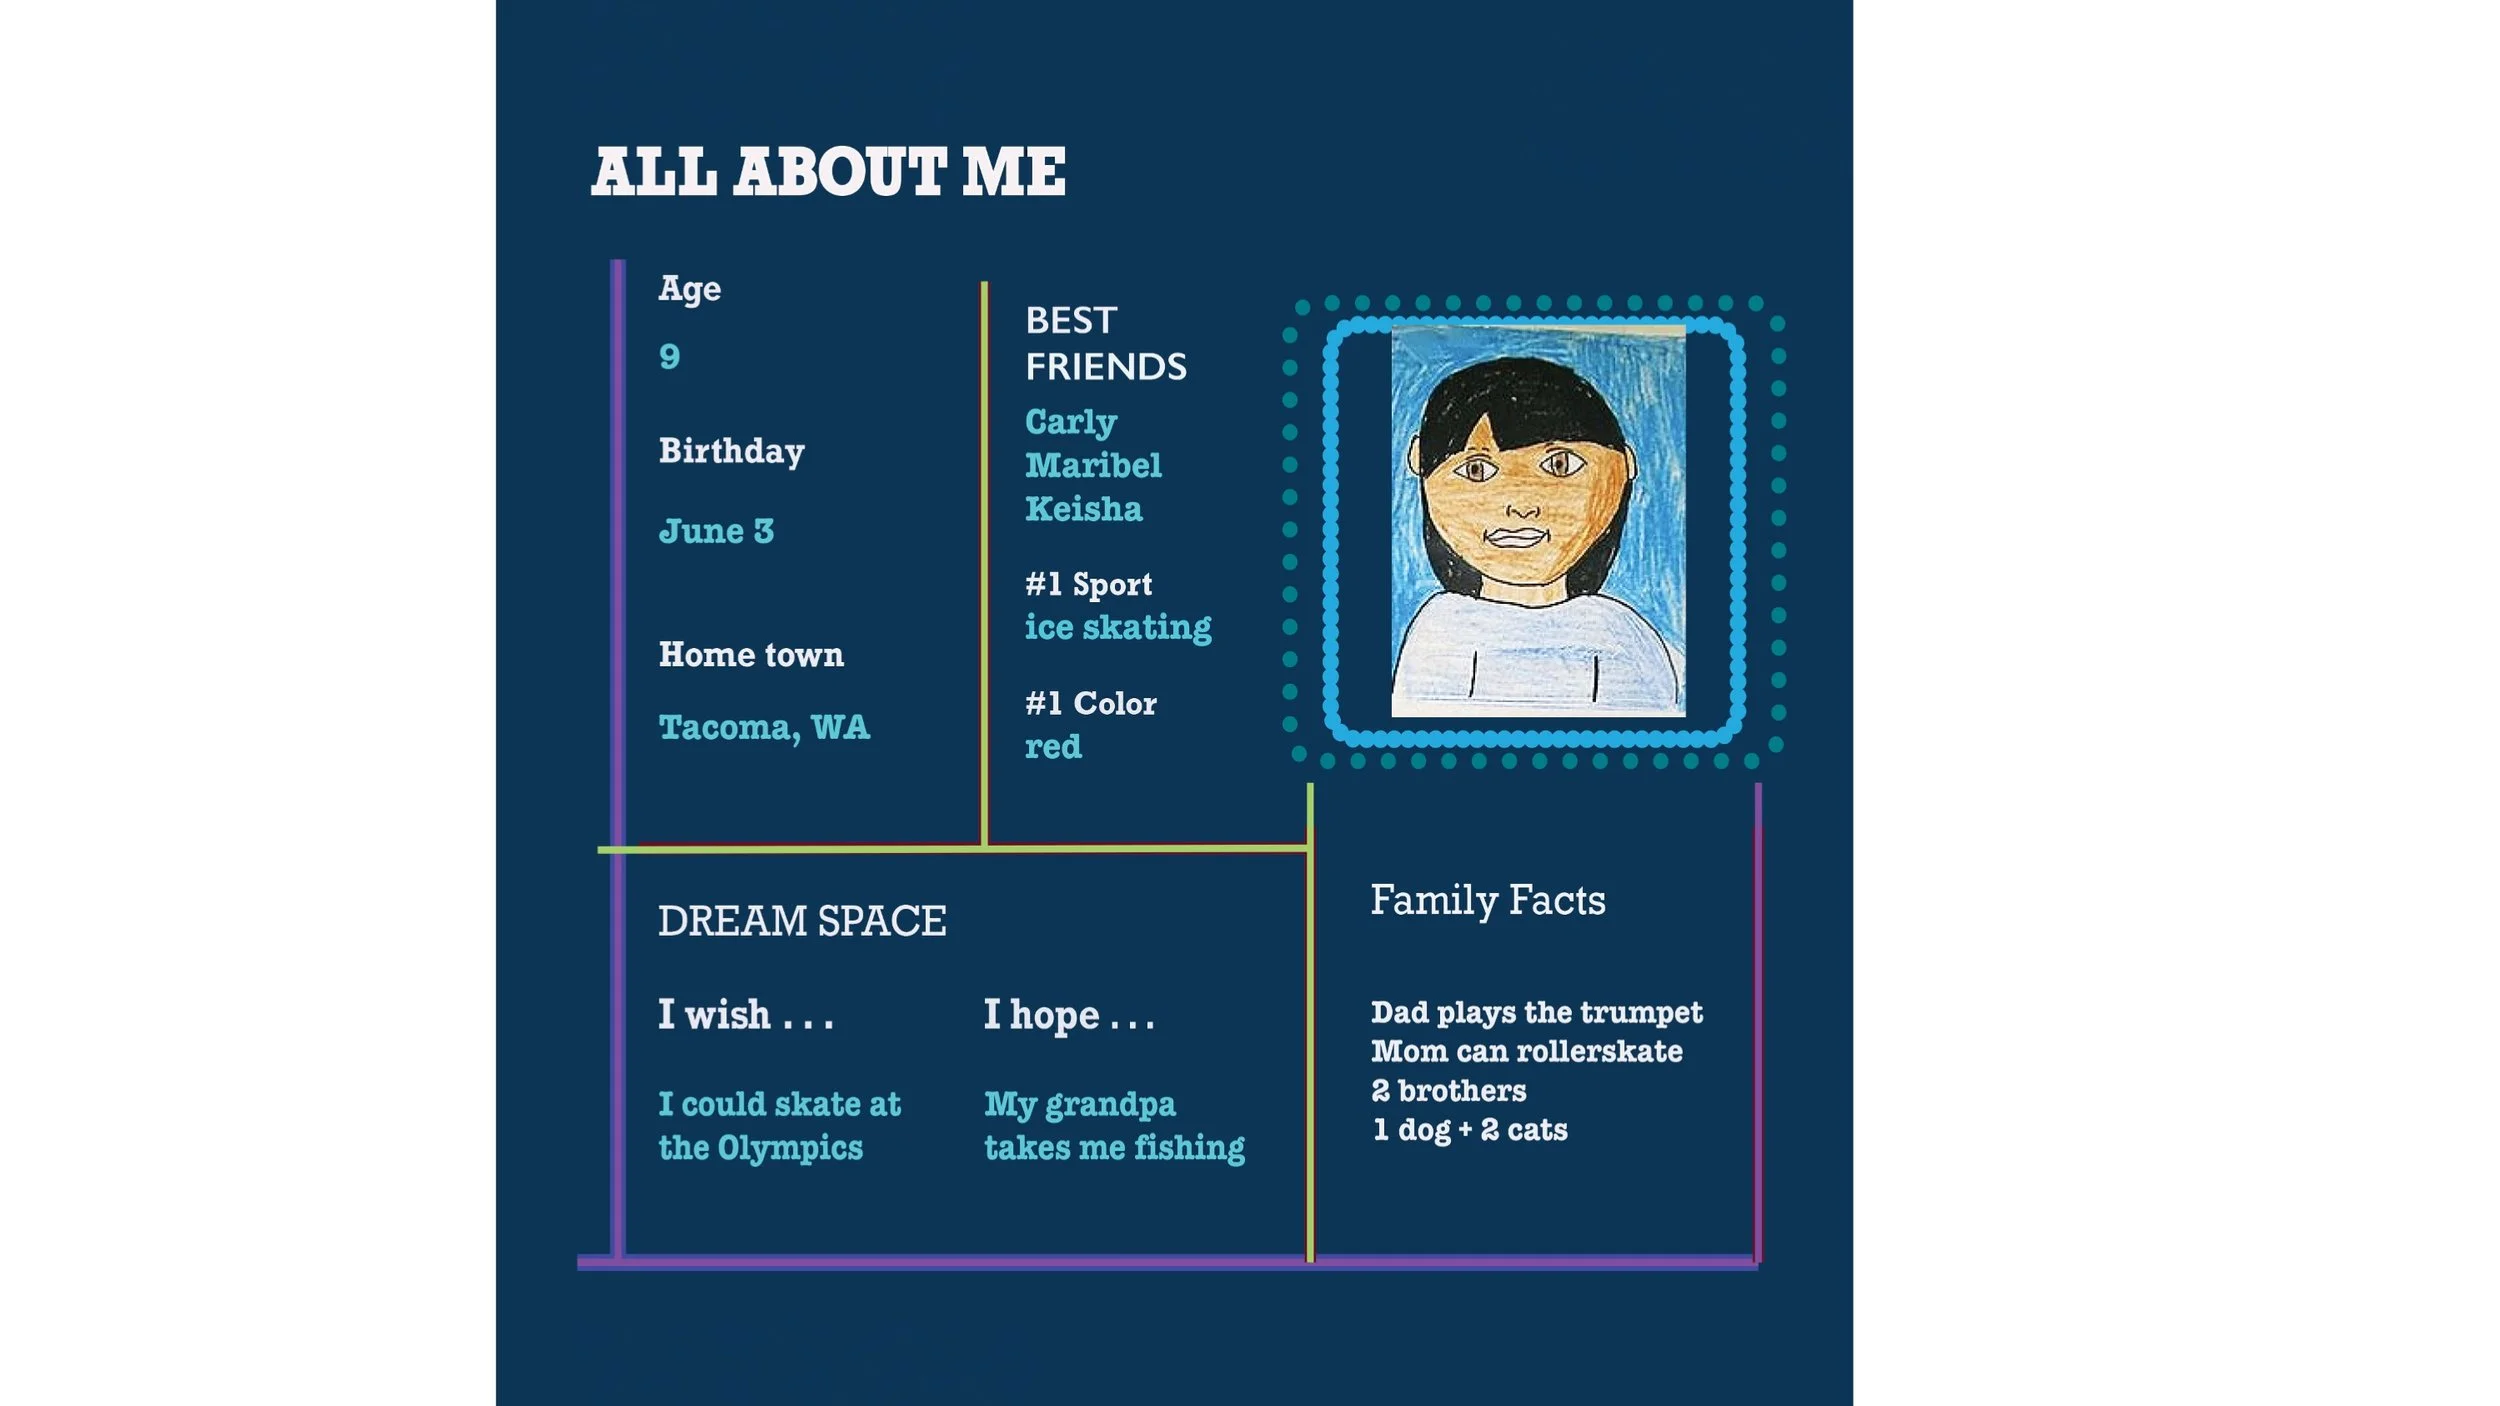
Introduce yourself
Capture life’s highlights
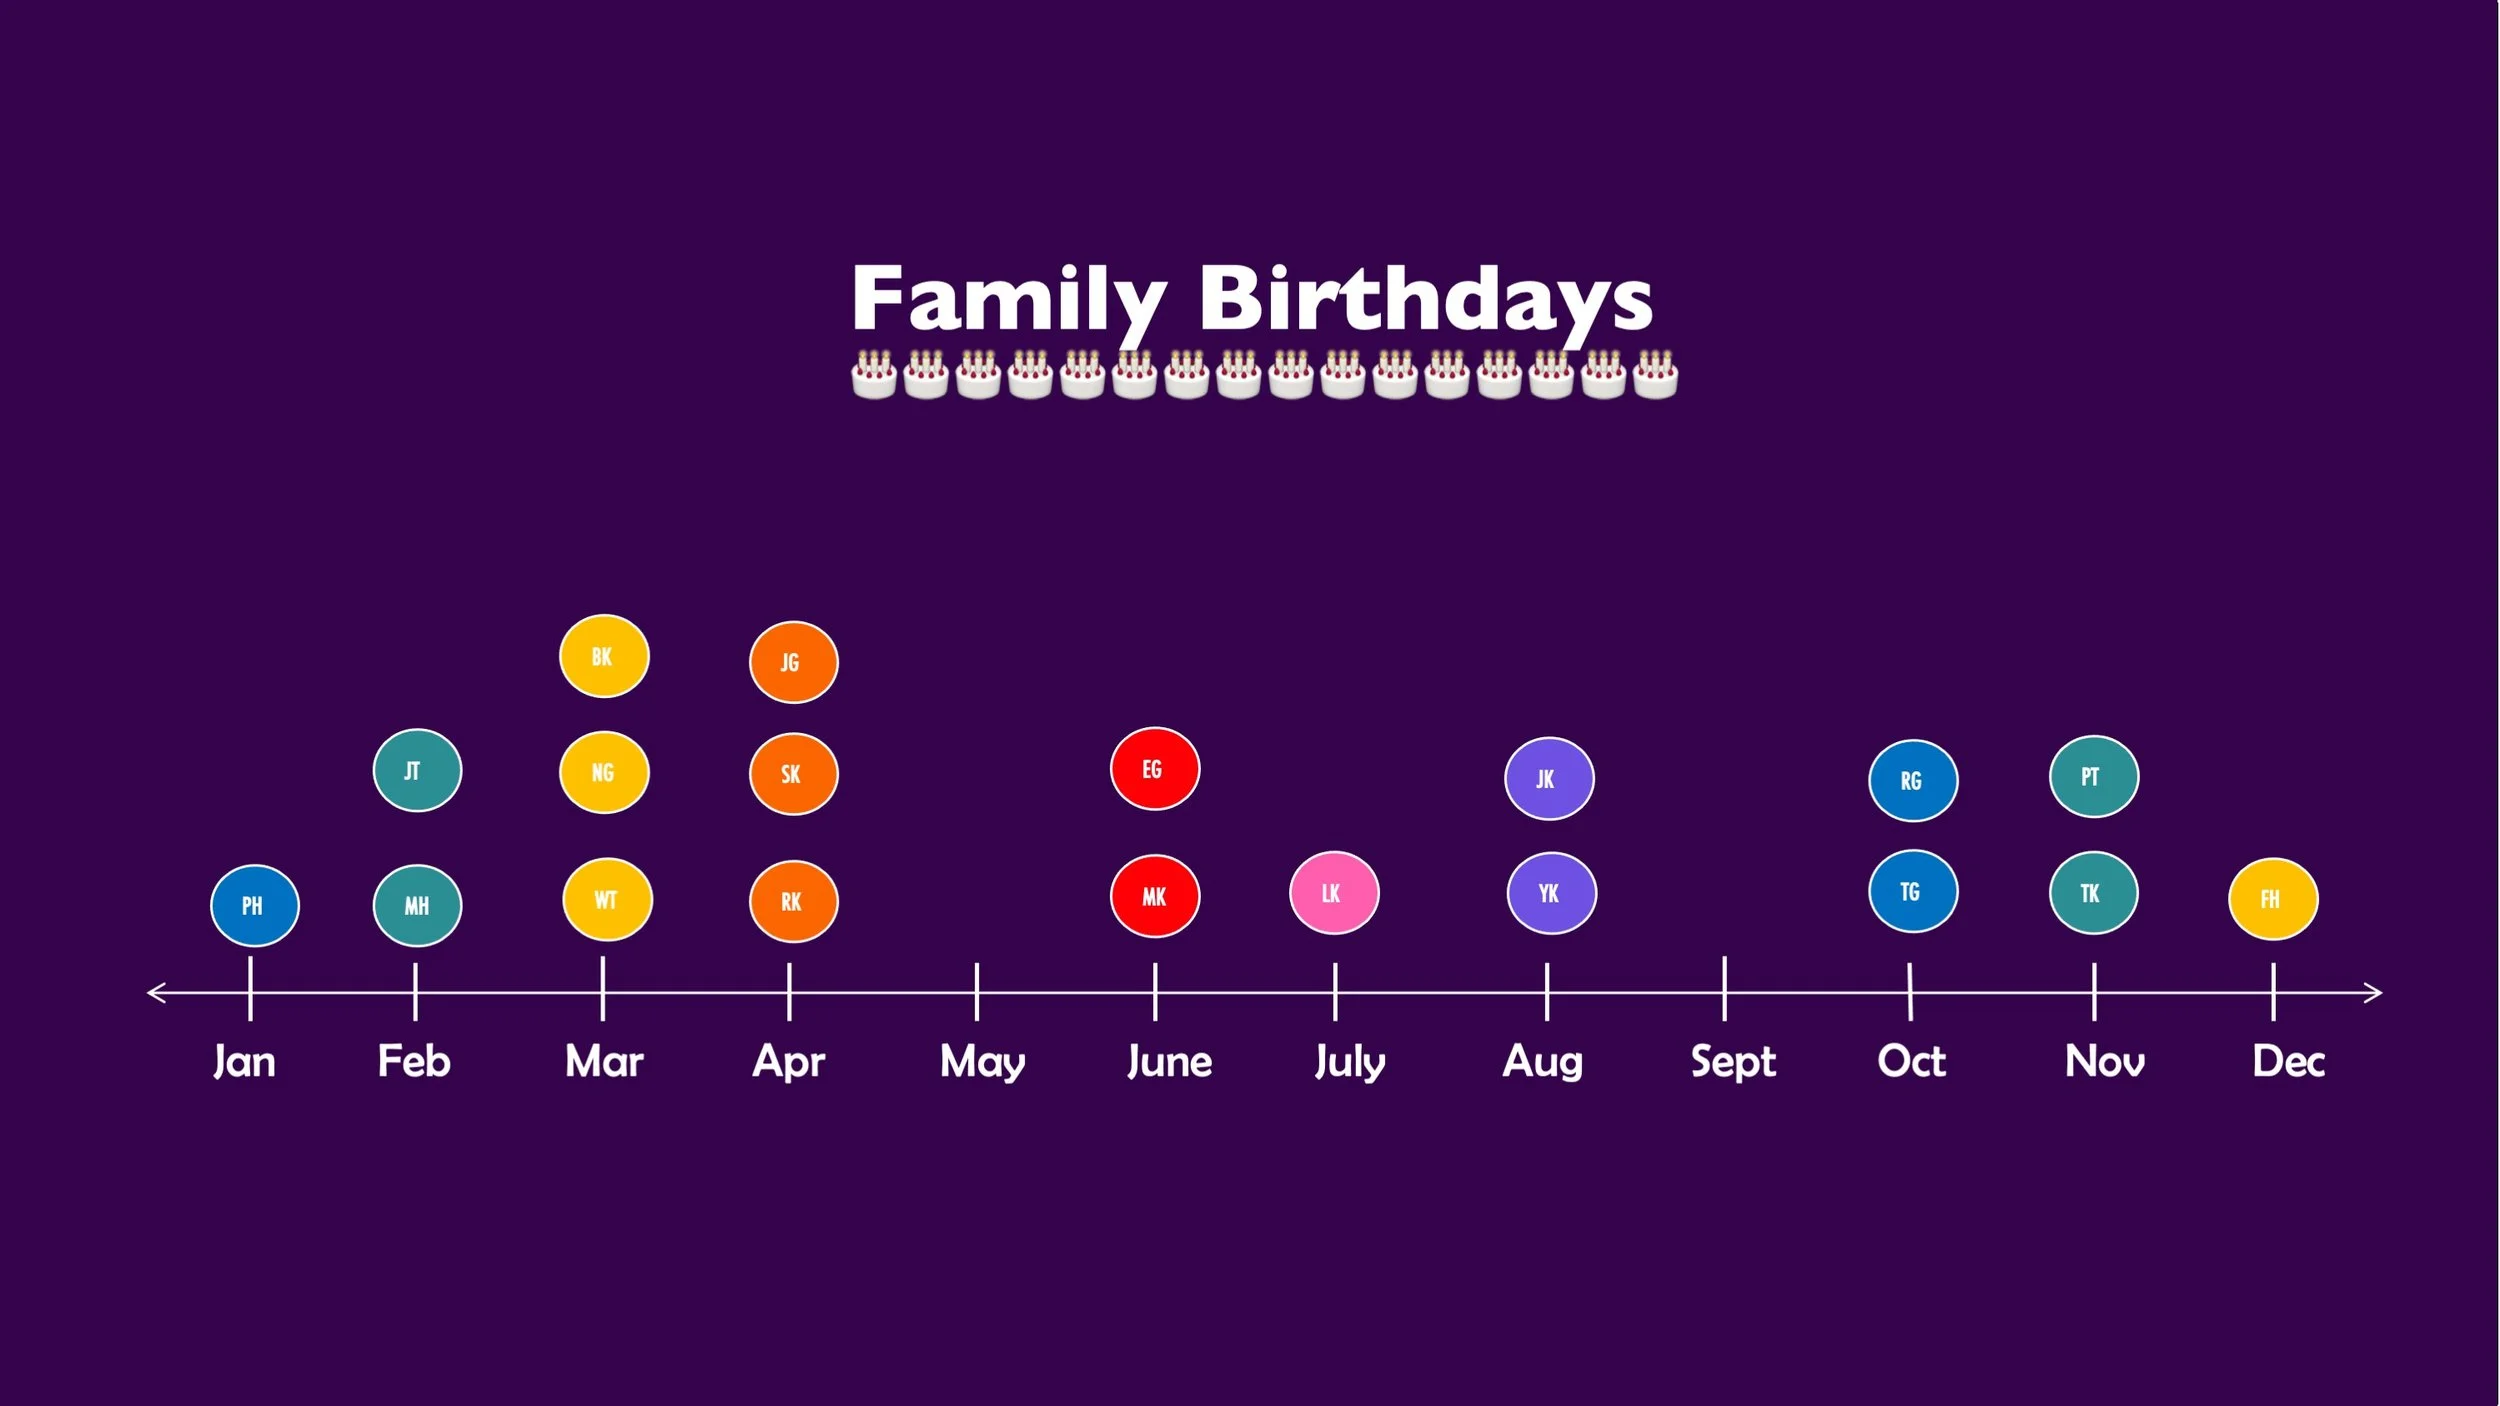
Chart birthdays
Go Green
Go Green
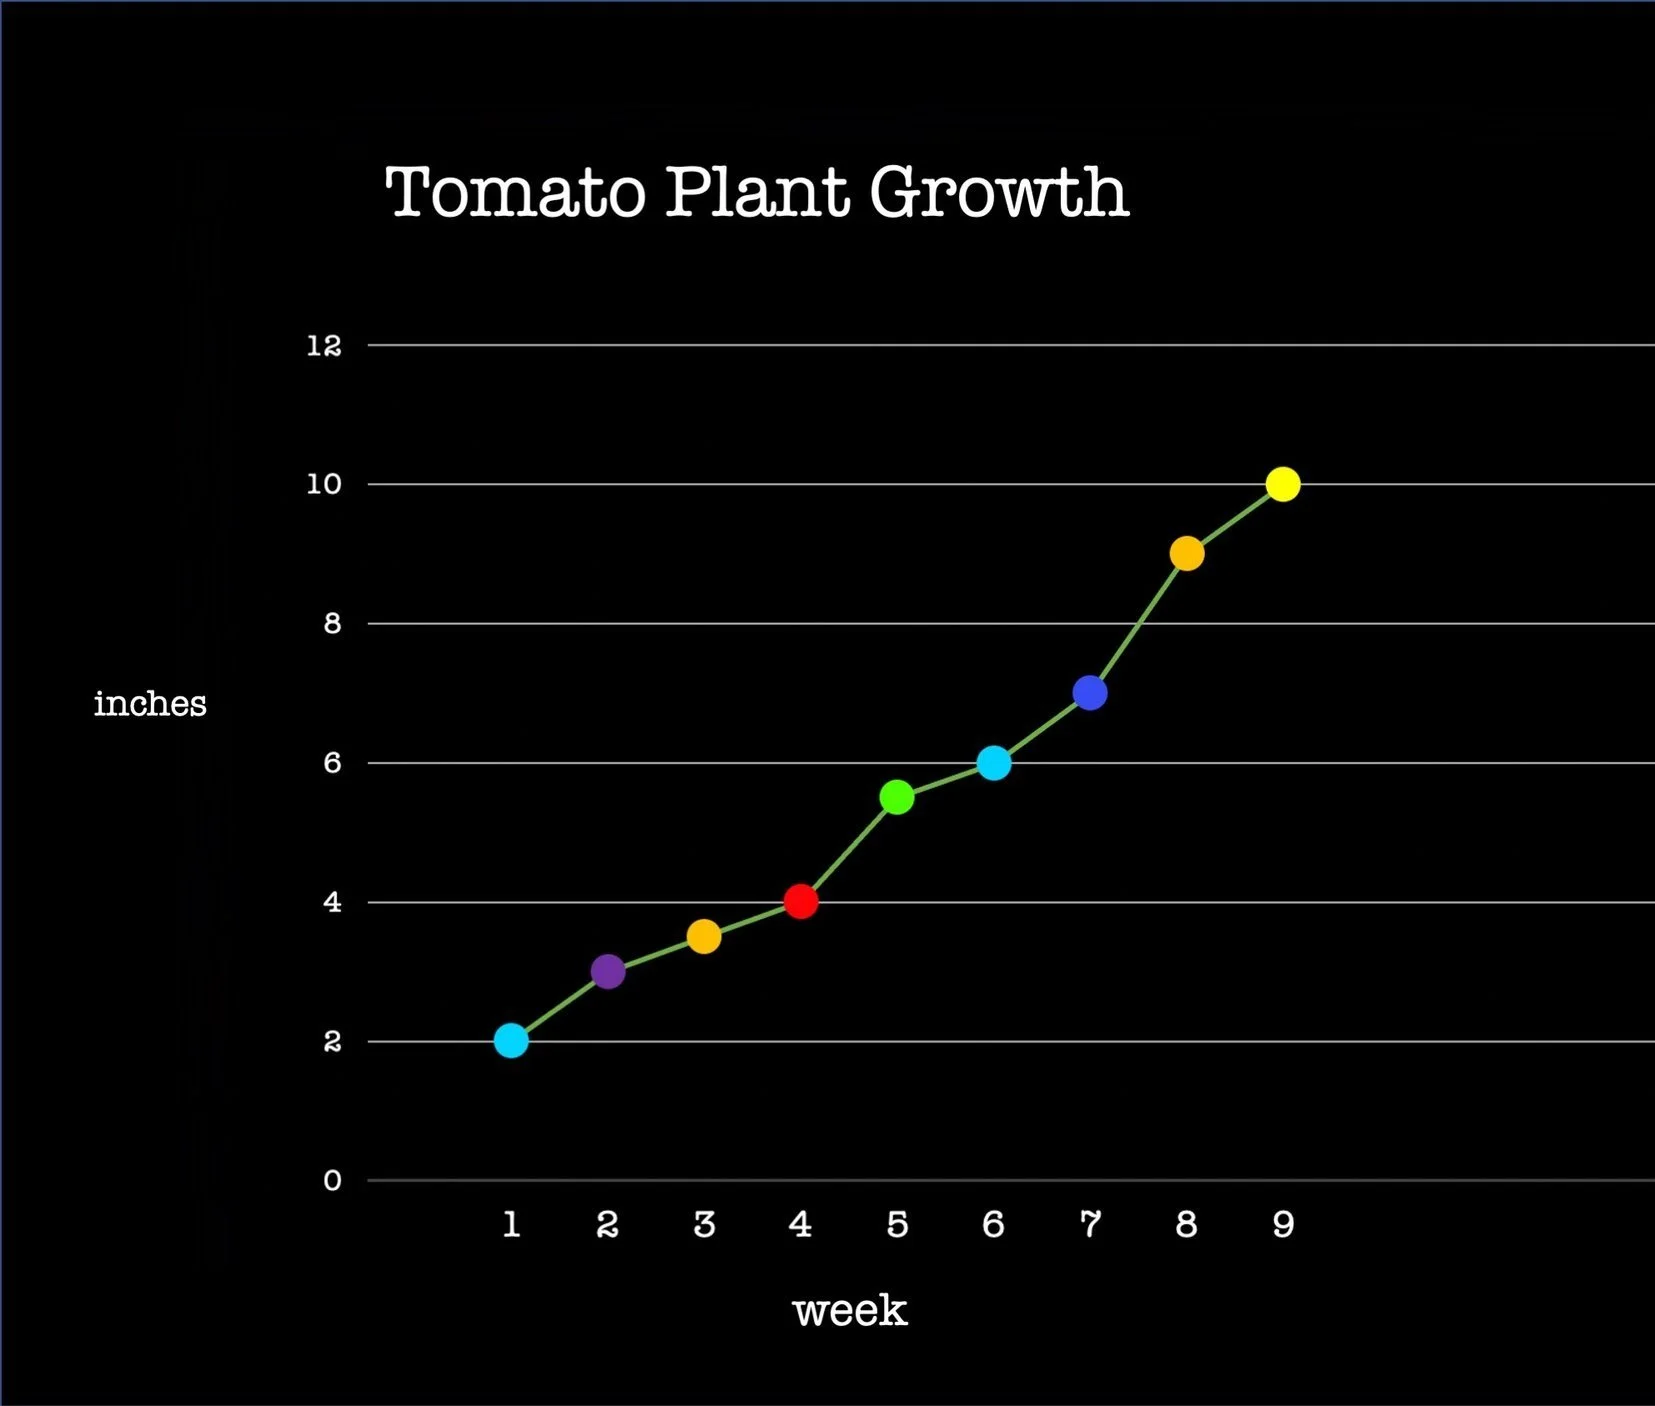
Track plant growth
Count pollinators
Do a school survey
Chill Time
Chill Time
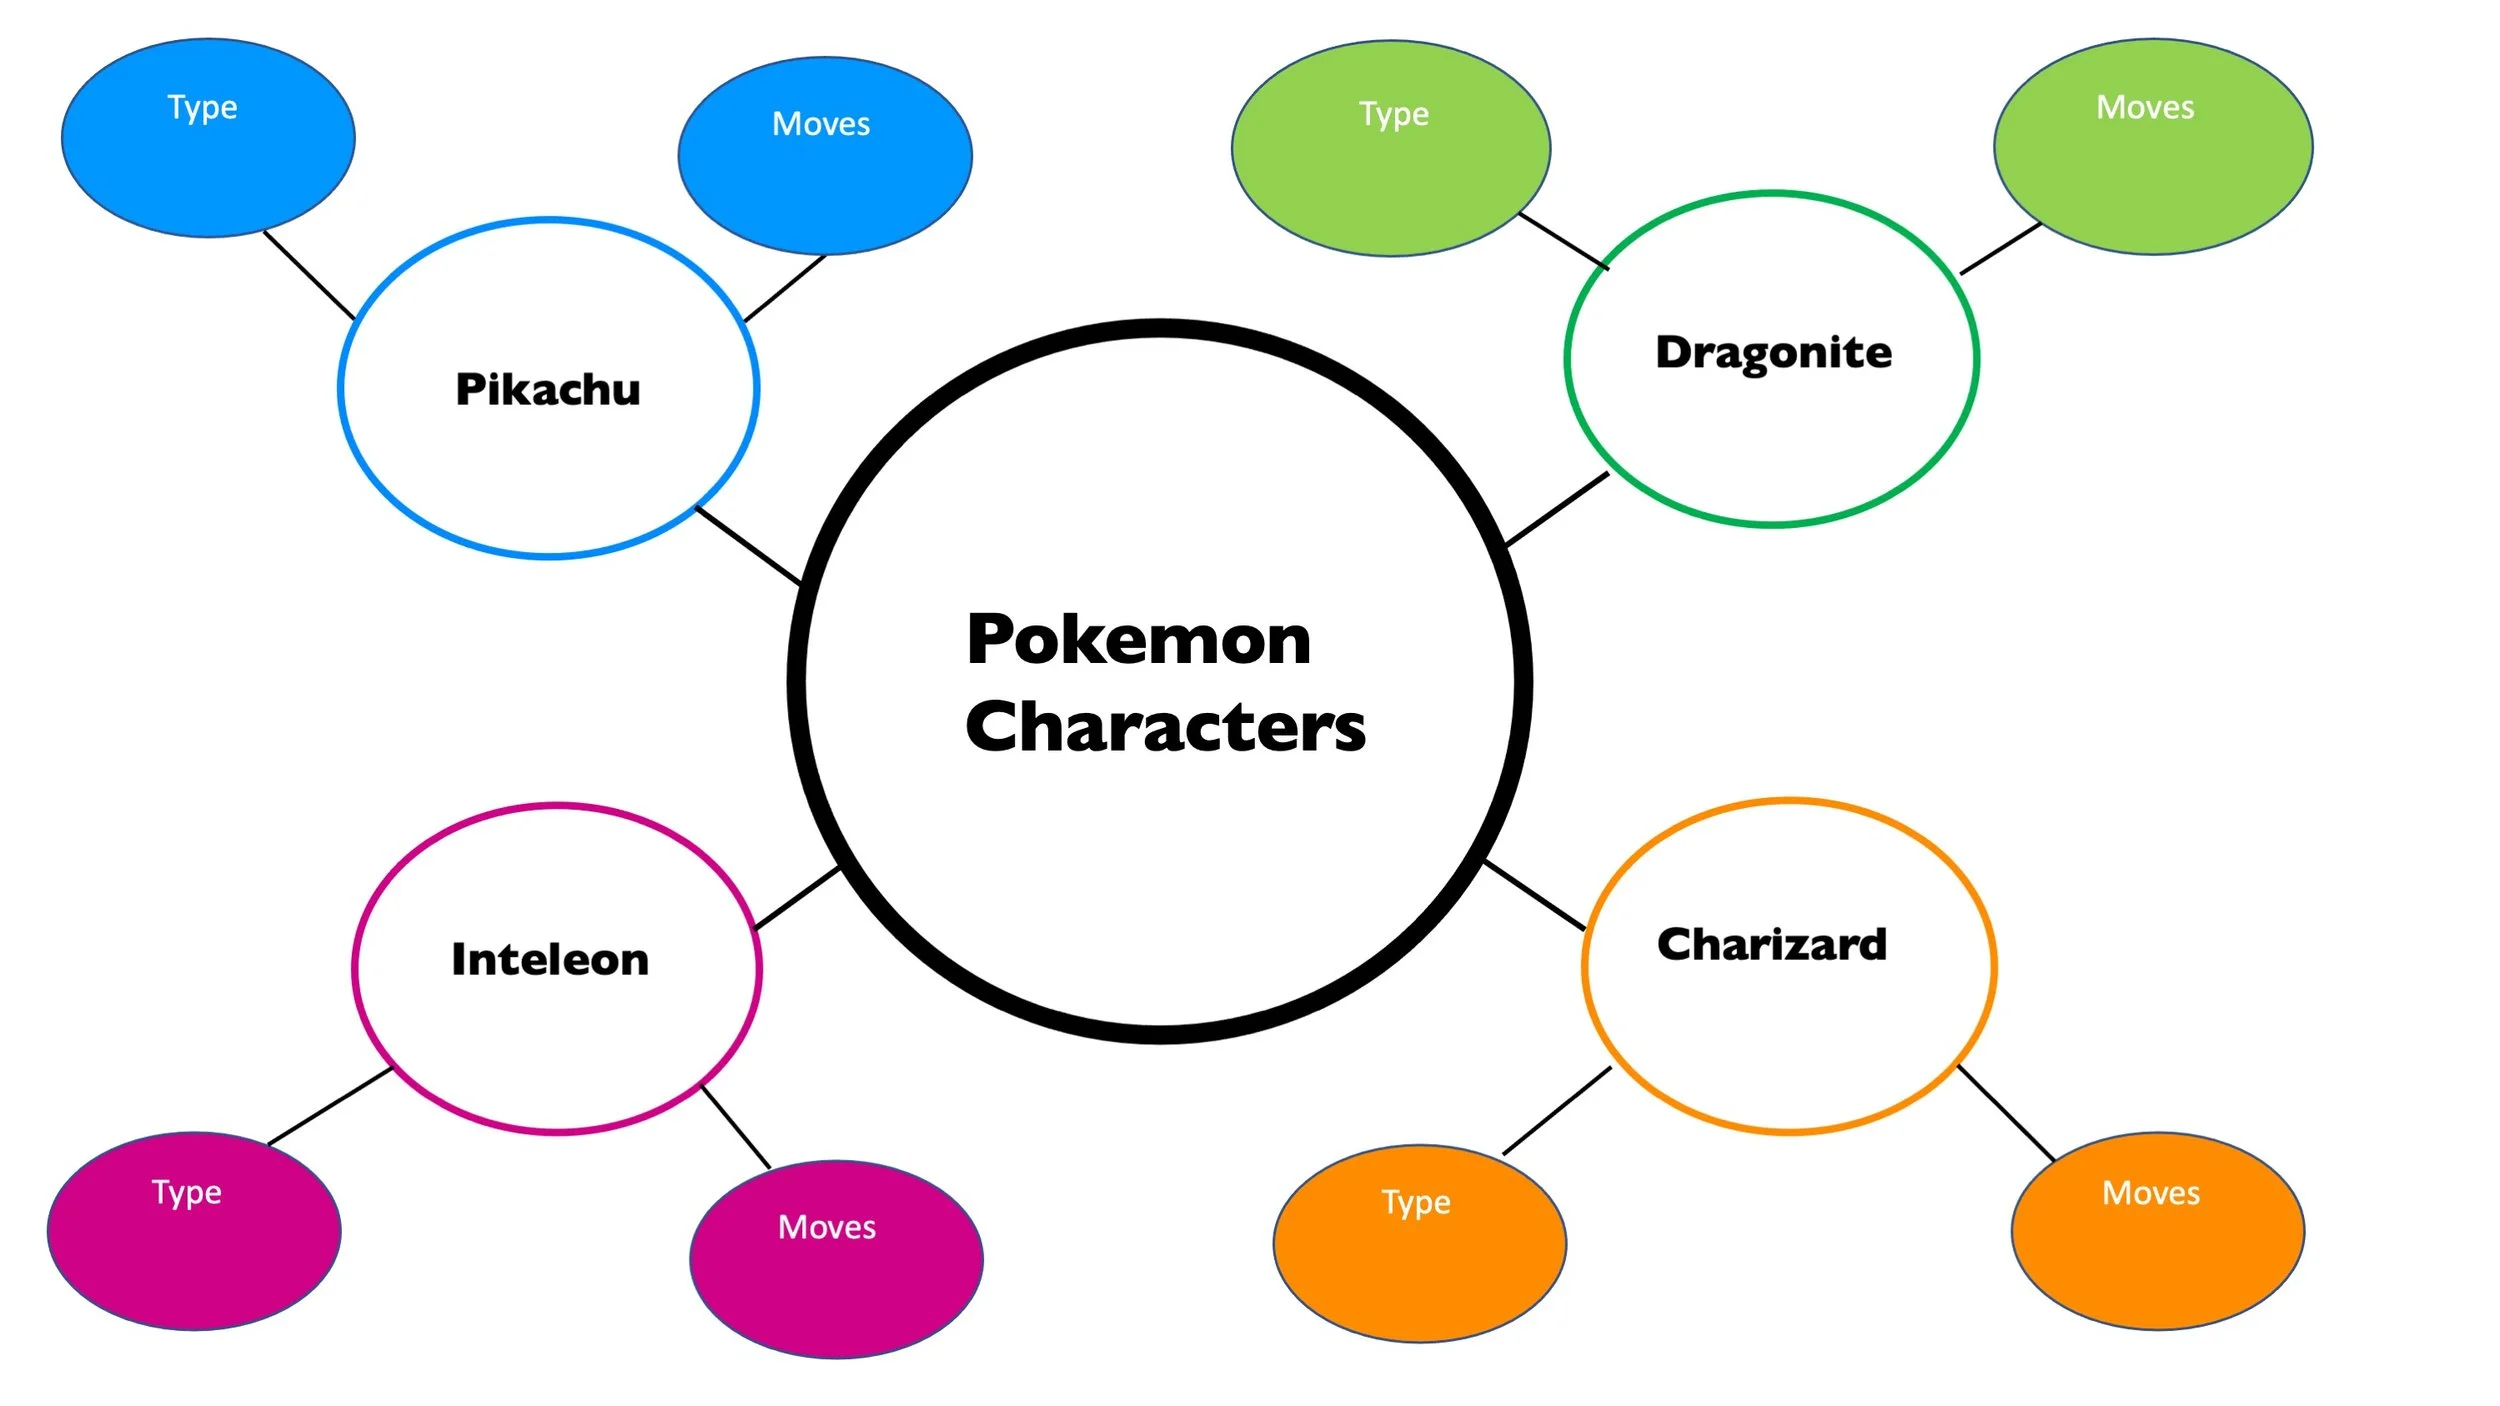
Map favorite characters
Teach a friend a game
Viz a day in your life
Food Facts
Food Facts
Create a recipe
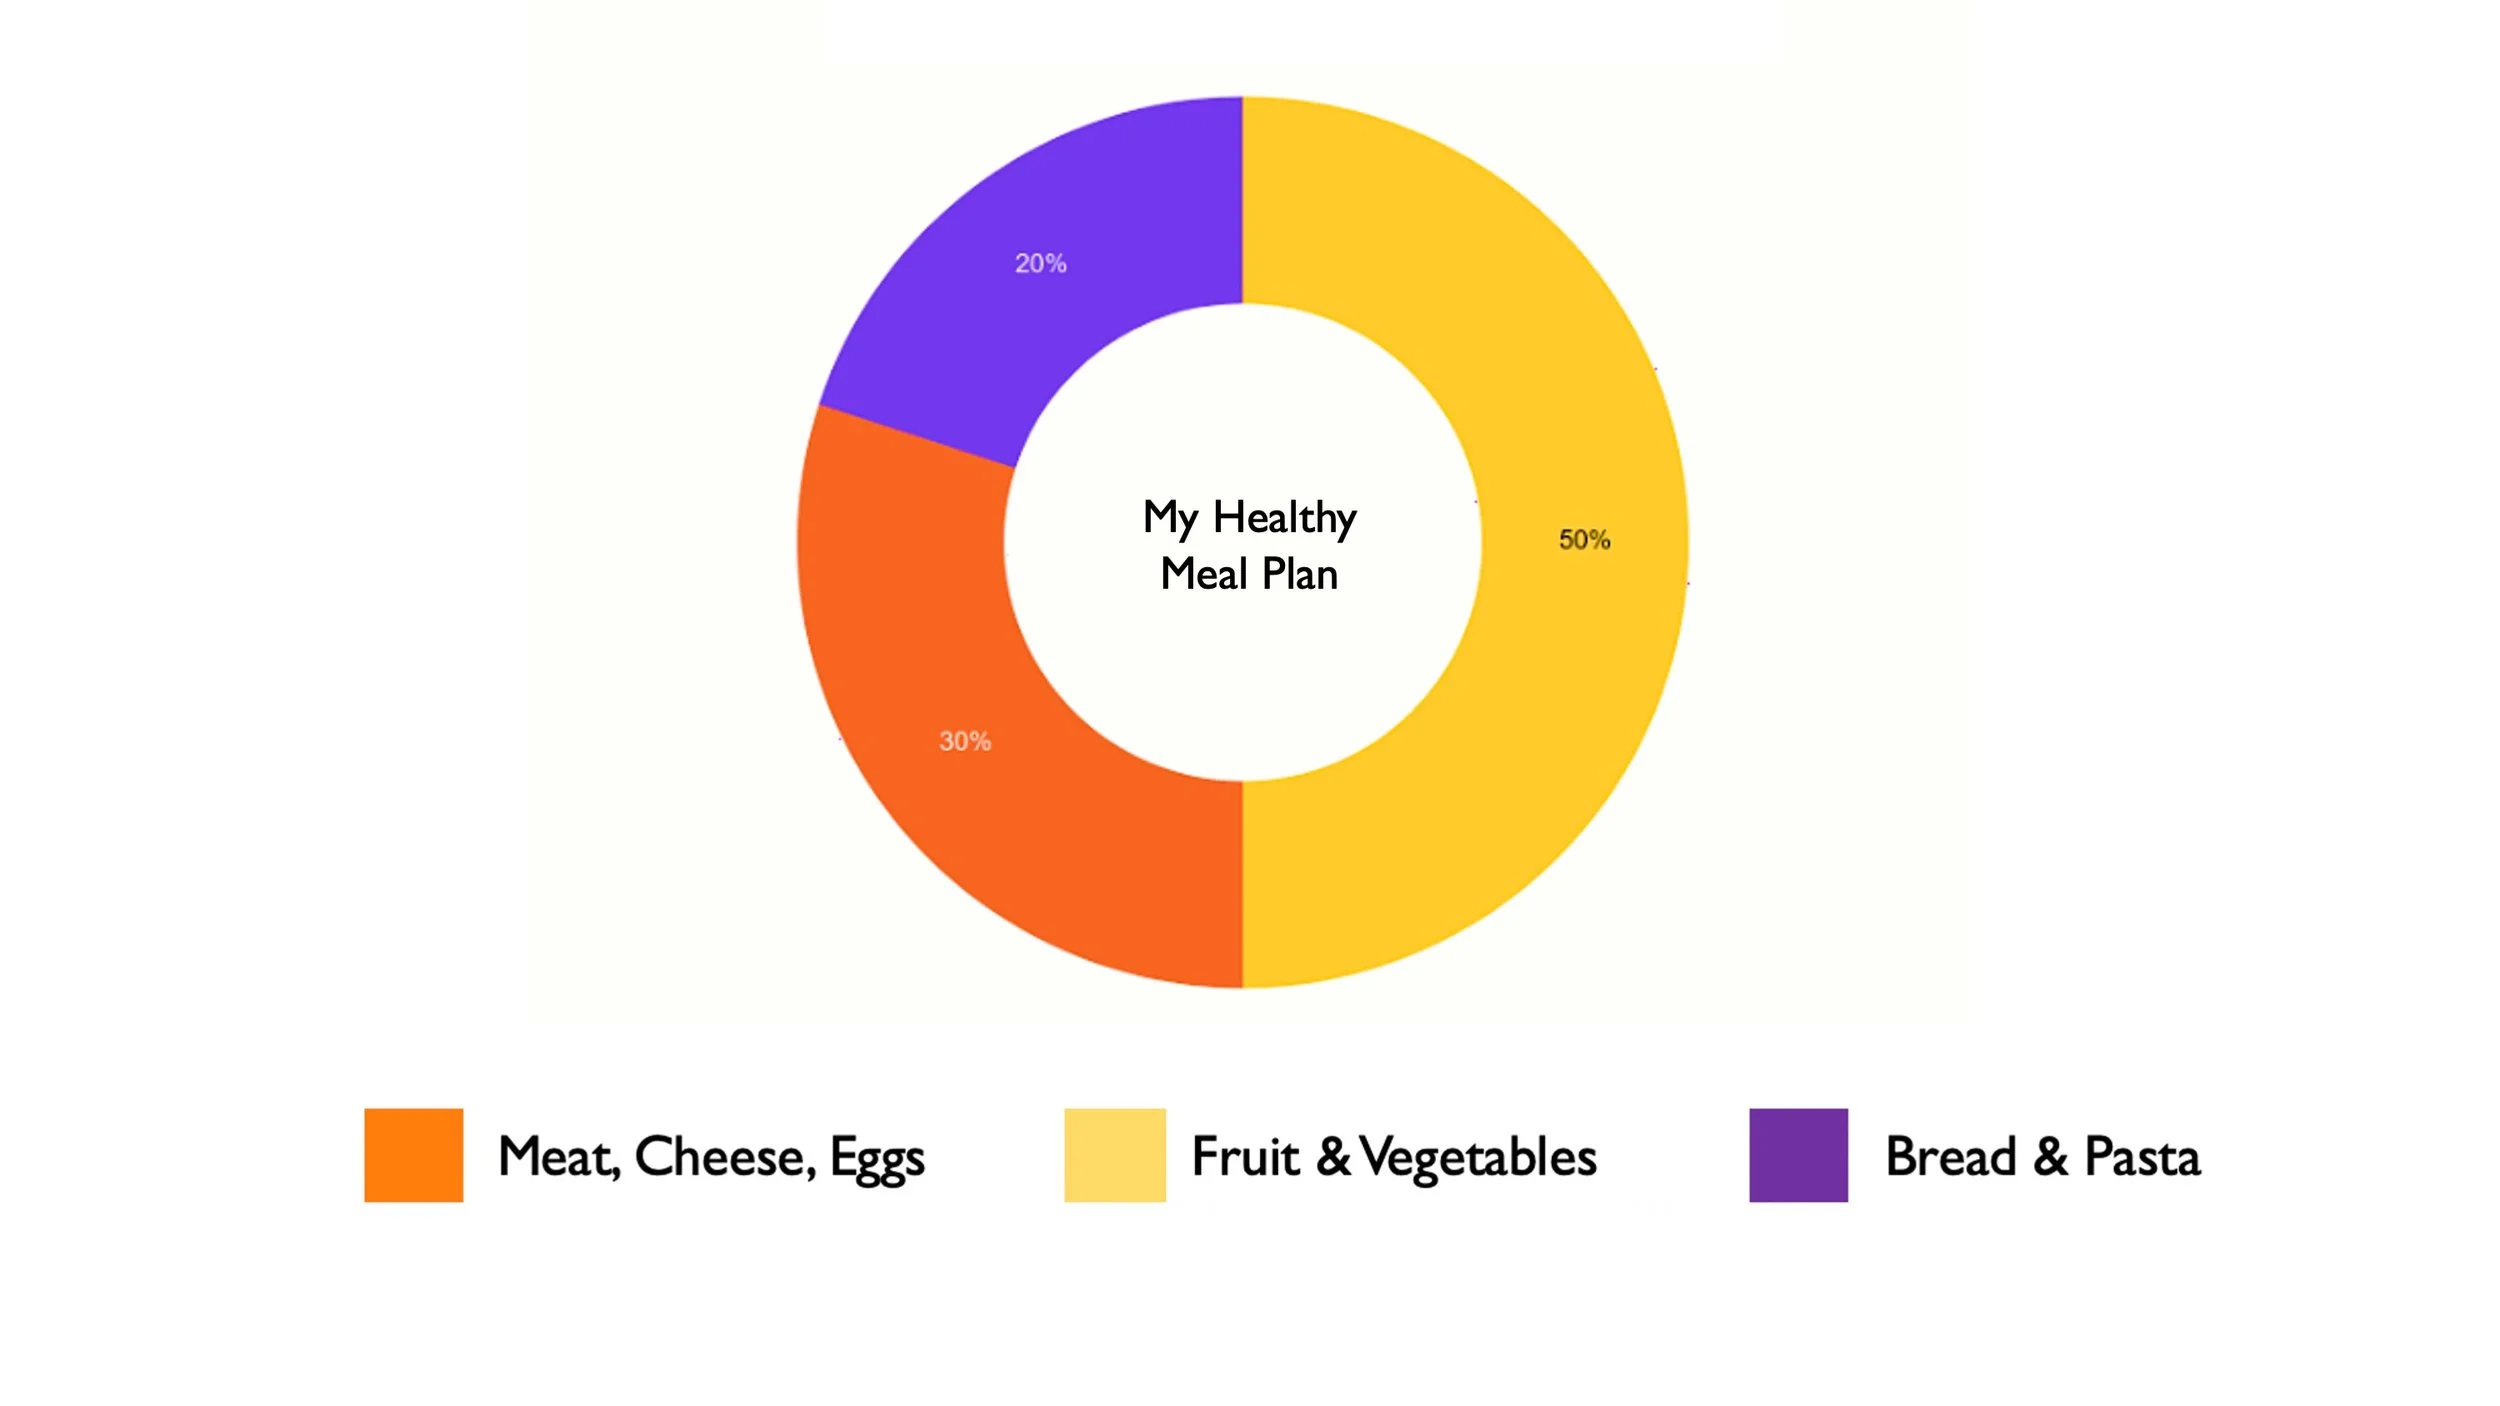
Make a meal plan
Find eating patterns
Sports Stats
Sports Stats
See who’s got game
Create a group profile
Track performance
Bar Graph
Bubble Chart
Dot Plot
Flow Chart
Histogram
Infographic
Line Graph
Mind Map
Pictograph
Pie Chart
FEATURED TEMPLATES
Pin Map
Ranked List
Scatterplot
Tally Chart
Timeline
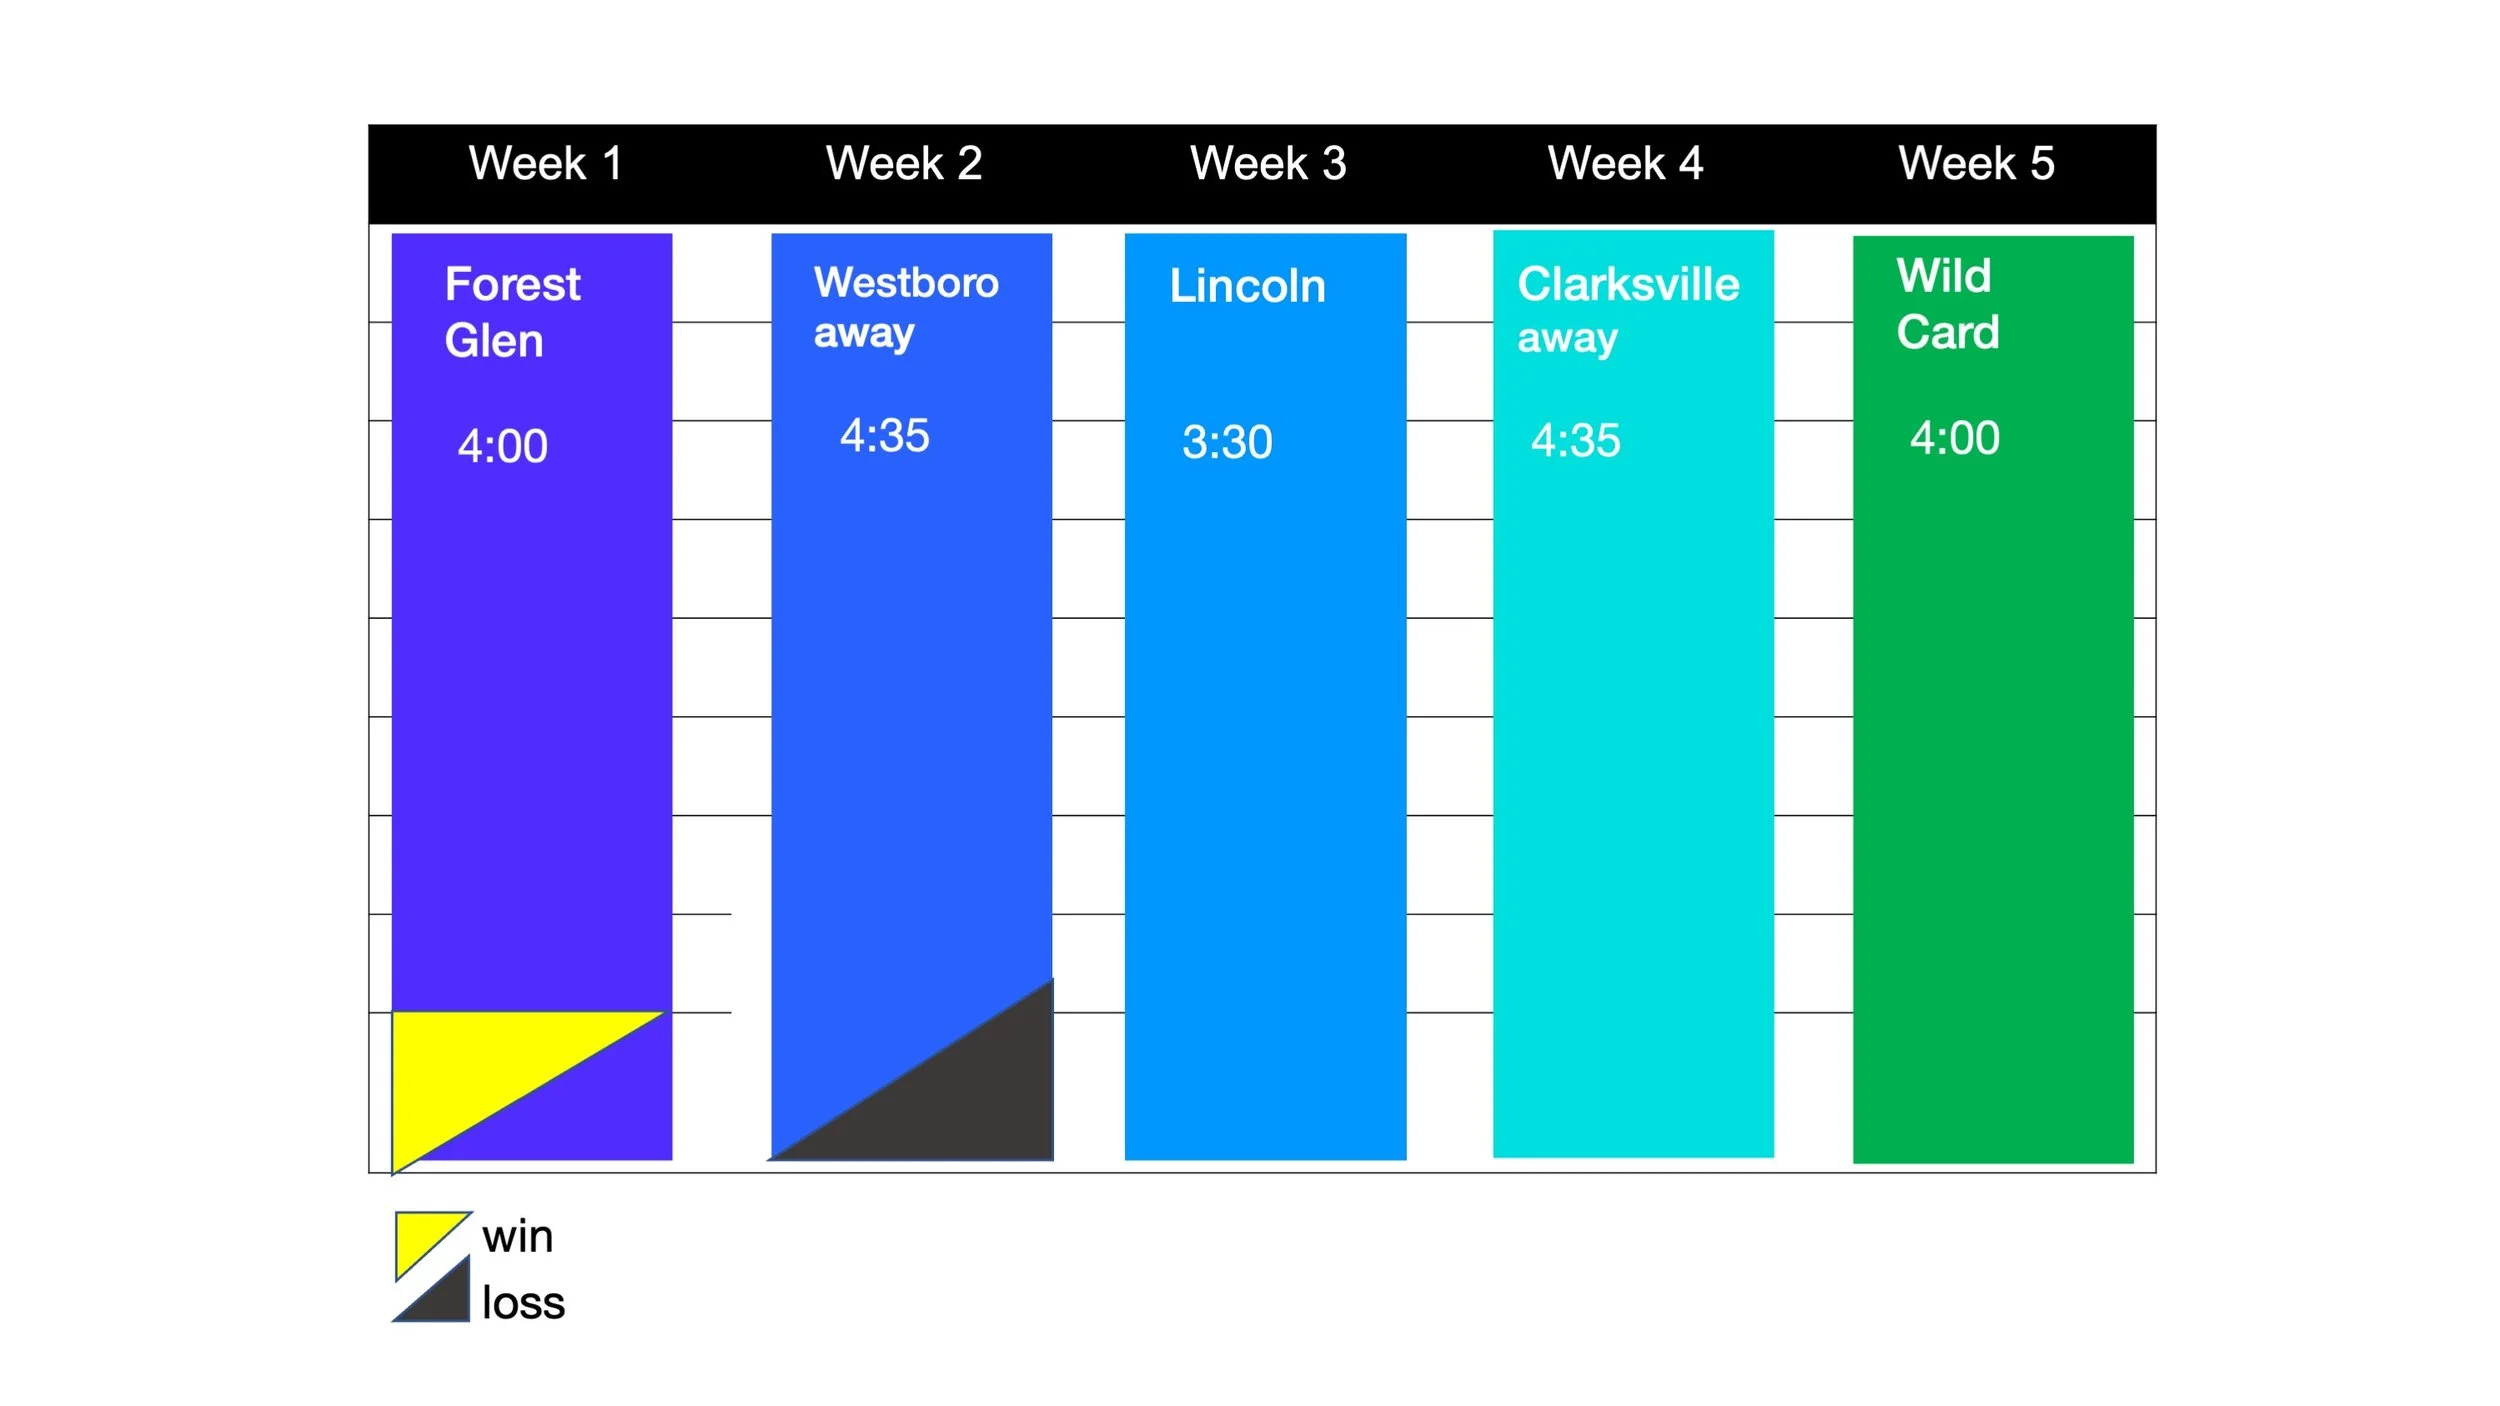
Time Table
Tree Diagram
Venn Diagram
Word Cloud

